BirdWalker, then and now

About time, too. He’s been looking dreadful for days; I’ve been telling him to get a move on.“—Albus Dumbledore about his phoenix Fawkes after Fawkes burst into flame

Just as Fawkes periodically must burst into flames and rise again from the ashes, so must my longstanding website project, BirdWalker.com. To better understand why it’s time for me to “get a move on”, here’s some background.

A brief history of BirdWalker

I’ve been watching birds since the mid-1990’s and programming computers since the early 1980’s. When my wife Mary and I started birding, I kept notes on paper while out watching birds. I wanted to count how many different bird species I’d seen in a given month or year or county. I quickly realized I wanted a database to help me track these numbers, and thought it would be fun to build one from scratch. When I started photographing birds a few years later, I wanted to count how many different bird species I had photographed as well. BirdWalker 3 is the the third incarnation of that tool. Here’s a quick look at how BirdWalker evolved.

Version 1, FileMaker Pro

I got serious about birding during the height of my FileMaker Pro obsession. FileMaker Pro was a simple database engine combined with user interface tools. I made my first birding database with FileMaker Pro. I ran it locally on my own laptop and never hooked it up to the web. I used my Palm V to record sightings in the field. Although there were ways to publish FileMaker Pro databases as web sites, I never got around to using them.

Version 1.5, XSLT

In 2001, while working at Reactivity, I had the idea to export my FileMaker Pro data as XML text files while I was learning XSLT. XSLT (eXtensible Stylesheet Language Transformations) is a language for describing how to transform one file format into another. I transformed the raw data of my bird sightings into a website of different kinds of reports, all linked together. I became the XSLT expert at Reactivity (there wasn’t much competition for that title, believe me). I disliked SQL databases and hadn’t really learned about CSS or JavaScript, so I was using XSLT to do the work of a database and an application server and a presentation layer. The complexity of the resulting code, plus XSLT’s arcane syntax, lead to an idiosyncratic, unmaintainable monster.
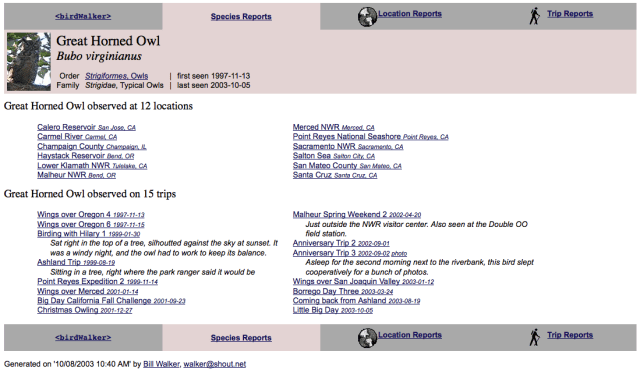
birdwalker-xslt-species

BirdWalker, XSLT version, October 2003. This page is a species report showing all my observations related to Great Horned Owls, including when and where I observed them, plus my first photo of this species

Version 2, Linux, PHP, MySQL

In 2003, I decided to abandon XSLT, overcome my distaste for SQL databases, and begin again in PHP and MySQL. This combination of tools, also known as LAMP, was much easier to learn and manipulate than XSLT, so I was able to build things much more quickly and easily. In addition to producing summaries and reports of my birding notes, I added the ability to record new notes right into the website.

In hindsight, my biggest mistake during this PHP era was ignoring the PHP community and their wisdom about how to cope with software complexity. Lacking role models, I ended up with a codebase that mingled topics that should have been kept separate, what Brian Foote calls a Big Ball of Mud. My code didn’t cope with errors, wasn’t well tested, and couldn’t be easily extended.

Version 3, Ruby on Rails

In 2007, I saw the classic Ruby on Rails “make a blog in 15mins” video and was hooked. I created the BirdWalker 3 repository on GitHub and started on a new version using basically the same SQL schema as I used with PHP. Thanks to the Rails scaffolding generator and separation of concerns, I ended up with structured code and automated tests. I also adopted Twitter’s Bootstrap framework, so the web site would work on both my iPhone while out in the field and on my laptop back home. BirdWalker version 3 is still the code that runs when you visit birdwalker.com.
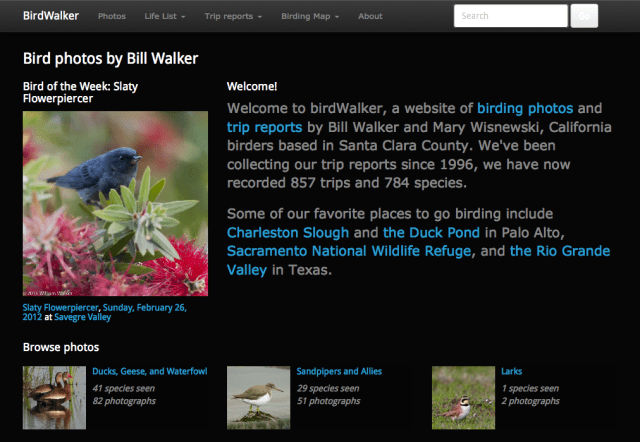
birdwalker3-screenshot.png

BirdWalker, Ruby on Rails version, February 2016. The homepage consists of several Rails partial templates that can be rearranged as needed.

I like it well enough, but there are some big problems:

Big ball of mud

I’ve mostly forgotten how my own Rails code works — my Rails HTML templates and CSS styles are overly complex and hard to modify. Also, there are a lot of half-finished parts, such as better ways to do editing and heuristics for adapting page templates to varying amounts of data.

Application server — slow and overpriced; necessary?

I’m hosting BirdWalker 3 on an Amazon EC2 m1.small instance running MySQL and Rails. This both costs more than I want while being slower than I’d like. Given that the data in the SQL database only changes when I add new sightings (once or twice a week), administering and paying for this whole server feels like overkill.

The ascendance of eBird

While I was building and living with BirdWalker 3, Cornell University’s eBird grew and gained prominence among the birders I know. I exported my SQL database into the eBird format, and uploaded over 20,000 sightings into my eBird account. This is my contribution to eBird’s massive citizen science project, which I love. eBird also lets me compete with my peers in logging the most eBird sightings.

But now I have two sources of truth for my birding life, BirdWalker and eBird. As eBird matures, I find that maintaining my own data entry tools for birding makes no sense. I’d much rather do all my data entry at eBird and then base my website on data exports from eBird.

Arising from the Ashes

I’ve made two experiments since 2013 in preparation for replacing BirdWalker 3. The first was about replacing Ruby on Rails with JavaScript and Angular. The second was about replacing server-side code with static hosting.

An Angular transplant

I have frequently and loudly evangelized the advantages of single page web apps as part of my work at Mozilla. Following my own advice, in August 2013 I started to rework BirdWalker using Angular. (I actually tried twice, once with a web components library named Brick and a second time with Twitter Bootstrap). I recreated almost all of the reporting and browsing parts of my site using Angular controllers and templates (see http://birdwalker.com/angular/#/home). My Rails server-side code was reduced to a modest JSON API. Unfortunately, that code was still limited by SQL performance.

Static hosting of data-driven sites

In 2015 I was inspired by talks at the first GitHub Universe conference and a publishing tool my Mozilla coworkers made called Oghliner. This led me to experiment with publishing this site on GitHub Pages, moving all the application logic into the browser. I created a new code repository called ebird-mybird. I wanted to discover whether I could build a client-side web experience for browsing the CSV text file export from eBird. I’ve used these building blocks:

The results so far are functional, if not yet beautiful. It lets me view bird lists for individual days, whole years, specific locations, counties, and states. I’ve got a search that lets me find individual species and locations and trip names. When I make changes to the software, Oghliner automatically rewrites my service worker and updates GitHub Pages using Travis-CI. On most laptops with broadband, the front page starts drawing in less than half a second, and the whole site is ready in about 3 seconds. On my iPhone 5, the front page starts drawing in less than a second, but takes 25 seconds to load completely, way too slow. Almost all of that time is spent parsing 4MB of eBird data, which is crazy. Almost as crazy as writing a website entirely in XSLT.

Now what?

Having discussed the above with several folks, I think my next step is to parse the CSV file on the server instead of the client, and to make a simple NodeJS server with a simple REST API that talks to a client with either the Handlebars templates I built or the Angular code I abandoned. I’ll keep you posted.

Advertisement
Posted in HTML5, Ruby on Rails | Leave a comment

Birdsongs, Musique Concrète, and the Web Audio API

In January 2015, my friend and collaborator Brian Belet and I presented Oiseaux de Même — an audio soundscape app created from recordings of birds — at the first Web Audio Conference. In this post I’d like to describe my experience of implementing this app using the Web Audio API, Twitter Bootstrap, Node.js, and REST APIs.

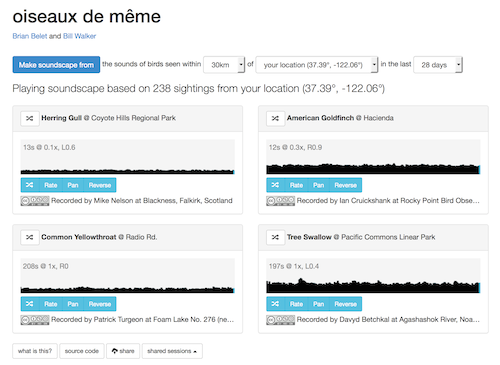
Screenshot showing Birds of a Feather, a soundscape created with field recordings of birds that are being seen in your vicinity.

Screenshot showing Birds of a Feather, a soundscape created with field recordings of birds that are being seen in your vicinity.

What is it? Musique Concrète and citizen science

We wanted to create a web-based Musique Concrète, building an artistic sound experience by processing field recordings. We decided to use xeno-canto — a library of over 200,000 recordings of 9,000 different bird species — as our source of recordings. Almost all the recordings are licensed under Creative Commons by their generous recordists. We select recordings from this library based on data from eBird, a database of tens of millions of bird sightings contributed by bird watchers everywhere. By using the Geolocation API to retrieve eBird sightings near to the listeners’ location, our soundscape can consist of recordings of bird species that bird watchers have reported recently near the listener — each user gets a personalized soundscape that changes daily.

Use of the Web Audio API

We use the browser’s Web Audio API to play back the sounds from xeno-canto. The Web Audio API allows developers to play back, record, analyze, and process sound by creating AudioNodes that are connected together, like an old modular synthesizer.

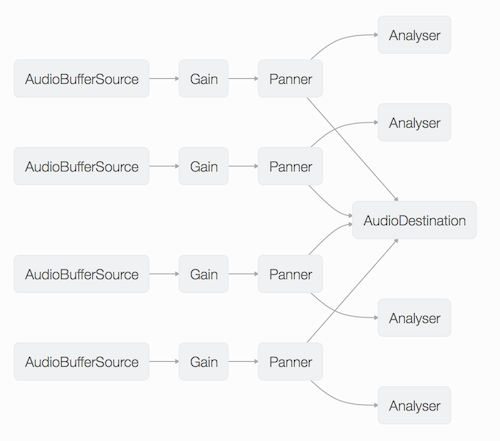
Our soundscape is implemented using four AudioBuffer nodes, each of which plays a field recording in a loop. These loops are placed in a stereo field using Panner nodes, and mixed together before being sent to the listener’s speakers or headphones.

Controls

After all the sounds have loaded and begin playing, we offer users several controls for manipulating the sounds as they play:

  • The Pan button randomizes the spatial location of the sound in 3D space.
  • The Rate button randomizes the playback rate.
  • The Reverse button reverses the direction of sound playback.
  • Finally, the Share button lets you capture the state of the soundscape and save that snapshot for later.

The controls described above are implemented as typical JavaScript event handlers. When the Pan button is pressed, for example, we run this handler:

// sets the X,Y,Z position of the Panner to random values between -1 and +1
BirdSongPlayer.prototype.randomizePanner = function() {
  this.resetLastActionTime();
  // NOTE: x = -1 is LEFT
  this.panPosition = { x: 2 * Math.random() - 1, y: 2 * Math.random() - 1, z: 2 * Math.random() - 1}
  this.panner.setPosition( this.panPosition.x, this.panPosition.y, this.panPosition.z);
}

Some parts of the Web Audio API are write-only

I had a few minor issues where I had to work around shortcomings in the Web Audio API. Other authors have already documented similar experiences; I’ll summarize mine briefly here:

  • Can’t read Panner position: In the event handler for the Share button, I want to retrieve and store the current Audio Buffer playback rate and Panner position. However, the current Panner node does not allow retrieval of the position after setting it. Hence, I store the new Panner position in an instance variable in addition to calling setPosition().

    This has had a minimal impact on my code so far. My longer-term concern is that I’d rather store the position in the Panner and retrieve it from there, instead of storing a copy elsewhere. In my experience, multiple copies of the same information becomes a readability and maintainability problem as code grows bigger and more complex.

  • Can’t read AudioBuffer’s playbackRate: The Rate button described above calls linearRampToValueAtTime() on the playbackRate AudioParam. As far as I can tell, AudioParams don’t let me retrieve their values after calling linearRampToValueAtTime(), so I’m obliged to keep a duplicate copy of this value in my JS object.
  • Can’t read AudioBuffer playback position: I’d like to show the user the current playback position for each of my sound loops, but the API doesn’t provide this information. Could I compute it myself? Unfortunately, after a few iterations of ramping an AudioBuffer’s playbackRate between random values, it is very difficult to compute the current playback position within the buffer. Unlike some API users, I don’t need a highly accurate position, I just want to visualize for my users when the current sound loop restarts.

Debugging with the Web Audio inspector

Firefox’s Web Audio inspector shows how Audio Nodes are connected to one another.

Firefox’s Web Audio inspector shows how Audio Nodes are connected to one another.


I had great success using Firefox’s Web Audio inspector to watch my Audio Nodes being created and interconnected as my code runs.

In the screenshot above, you can see the four AudioBufferSources, each feeding through a GainNode and PannerNode before being summed by an AudioDestination. Note that each recording is also connected to an AnalyzerNode; the Analyzers are used to create the scrolling amplitude graphs for each loop.

Visualizing sound loops

As the soundscape evolves, users often want to know which bird species is responsible for a particular sound they hear in the mix. We use a scrolling visualization for each loop that shows instantaneous amplitude, creating distinctive shapes you can correlate with what you’re hearing. The visualization uses the Analyzer node to perform a fast Fourier transform (FFT) on the sound, which yields the amplitude of the sound at every frequency. We compute the average of all those amplitudes, and then draw that amplitude at the right edge of a Canvas. As the contents of the Canvas shift sideways on every animation frame, the result is a horizontally scrolling amplitude graph.

BirdSongPlayer.prototype.initializeVUMeter = function() {
  // set up VU meter
  var myAnalyser = this.analyser;
  var volumeMeterCanvas = $(this.playerSelector).find('canvas')[0];
  var graphicsContext = volumeMeterCanvas.getContext('2d');
  var previousVolume = 0;

  requestAnimationFrame(function vuMeter() {
    // get the average, bincount is fftsize / 2
    var array =  new Uint8Array(myAnalyser.frequencyBinCount);
    myAnalyser.getByteFrequencyData(array);
    var average = getAverageVolume(array);
    average = Math.max(Math.min(average, 128), 0);

    // draw the rightmost line in black right before shifting
    graphicsContext.fillStyle = 'rgb(0,0,0)'
    graphicsContext.fillRect(258, 128 - previousVolume, 2, previousVolume);

    // shift the drawing over one pixel
    graphicsContext.drawImage(volumeMeterCanvas, -1, 0);

    // clear the rightmost column state
    graphicsContext.fillStyle = 'rgb(245,245,245)'
    graphicsContext.fillRect(259, 0, 1, 130);

    // set the fill style for the last line (matches bootstrap button)
    graphicsContext.fillStyle = '#5BC0DE'
    graphicsContext.fillRect(258, 128 - average, 2, average);

    requestAnimationFrame(vuMeter);
    previousVolume = average;
  });
}

What’s next

I’m continuing to work on cleaning up my JavaScript code for this project. I have several user interface improvements suggested by my Mozillia colleagues that I’d like to try. And Prof. Belet and I are considering what other sources of geotagged sounds we can use to make more soundscapes with. In the meantime, please try Oiseaux de Même for yourself and let us know what you think!

Posted in Uncategorized | Leave a comment

Highlights of the first Web Audio Conference

I recently had the pleasure of attending and presenting at the first Web Audio Conference, co-sponsored by IRCAM and Mozilla. I wanted to share some of the great things that I learned about there.

Meyada, Hugh Rawlinson

Meyada is a library for computing various properties of an audio signal, including various measure of perceived loudness. These measures are great for creating visualizations that users perceive as correlated with sounds. Hugh used them to make live visualizations inside his talk slides, very slick.

Extending Csound to the Web

Csound is a well-established programming language for generating and manipulating sound. Because it is written in standard C and has very few platform dependencies, it is an ideal candidate for cross-compilation with Emscripten and asm.js. The authors noted that the resulting code was not as fast as the PNaCL version they created, but that it was plenty fast enough to render many sounds in near real-time, and currently has a better cross-platform story.

musicn.js, Chris Lowis

Csound traces its lineage back to the MUSIC-N languages originated by Max Mathews at Bell Labs in 1957. Chris’s talk showed both how much has changed since then and how the fundamental ideas from MUSIC-N endure.

Lissajous, Kyle Stetz

Kyle Stetz described a very opinionated system he built for controlling live music by writing code in the Google Chrome Console window. He put his ideas on the line by doing a live demo in front of us, which was quite well-received. Although the system may not generalize to all styles of music, I think we all admired his clarity of purpose and great presentation.

HyperAudio

HyperAudio is a clean, simple UI for searching, browsing, and excerpting videos with spoken word audio, especially speeches and debates. The experience does rely on the hard work of creating  transcripts of the audio with very accurate timings; as automation makes that process easier, tools like HyperAudio will change the way ordinary people relate to video.

EarSketch, Jason Freeman

Jason Freeman and his colleagues at Georgia Tech brough a unique perspective to WAC. Instead of concentrating on how to use web technology to make music, they are interested in how to use web-based music tools to teach fundamental computer science concepts. When they use these techniques with high school students, they can show a significant increase in the number of traditionally under-represented groups in computer science.

The Tomb of the Grammarian Lysias, Ben Houge

The evening of the second day of the conference featured six different “Web Gigs”, which were participatory musical experiences designed around many mobile phones in a concert space with a centralized coordinator and sound system. In my opinion, the most successful of these was Ben Houge’s The Tomb of the Grammarian Lysias. The piece consists of solo vocalist singing an ancient poem in the original greek accompanied by snippets of vocal sounds. The accompaniment is played through the mobile phone speakers of everyone in the room, under the composer’s control. The carefully designed sounds emanating from dozens of speakers throughout the room gave a wonderfully diffuse, ethereal quality to the piece, while his clear singing voice provided a visceral, earthy contrast to all the technology involved.

Posted in Uncategorized | Leave a comment

Using Google Maps in a responsive design

[When I’m not in the office, I’m often out birding and photographing birds. To keep track of my life list and bird photos I wrote a Ruby on Rails site hosted at birdwalker.com; you can see all the source on github. This post is about some the evolution of that code]

I love maps and I love visualizing data, so when I started to accumulate location-based birding observations, I knew I wanted to visualize my data on a map. I created a Rails partial template called _google.html.erb that let me insert maps into any of my other templates. All was well.

Since the first version of that template I’ve struggled with two issues that I expect other web developers will encounter.

1. Making Google Maps responsive

When I first brought my Google Maps into a Twitter Bootstrap design, I found the Bootstrap CSS would resize the container for the map, as I hoped. Unfortunately, Bootstrap could not magically adjust the scaling or center of the map. As the map got smaller, it would show only the upper left corner of the original map area.

To fix this problem, I wrote a function to retrieve the width of the container, pass that info the Google Maps API, and trigger a resize event.

function resizeBootstrapMap() {
    var mapParentWidth = $('#mapContainer').width();
    $('#map').width(mapParentWidth);
    $('#map').height(3 * mapParentWidth / 4);
    google.maps.event.trigger($('#map'), 'resize');
    console.log(mapParentWidth);
}

I also added an event listener to invoke this function whenever the window changed size:

// resize the map whenever the window resizes
$(window).resize(resizeBootstrapMap);

2. How much interactivity should I provide?

When I finally got my maps to size up and down responsively, I was very pleased. I used Bootstrap’s grid layout, so that the multiple columns on big screens would collapse down to one column when viewed on phones, with the map taking up almost the whole width of the screen (you can use Firefox’s responsive design view to see this in action).

When you embed a Google Map, you get a lot of interactivity by default — panning, zooming, the ability to click on map pins and other objects. On laptops and desktops, I like the result. I can embed a map showing you an overview of all the places I’ve birded in my home county, where you can also let you zoom in and find the names and descriptions of each. But this interactivity can be a problem on phones. It became difficult to scroll through and beyond one of these maps. I’d be dragging my finger on the phone, and instead of scrolling the page, I’d be panning the map.

I then tested two alternatives. First, I tried using the Google Static Maps API, which has no interactivity. However, it doesn’t work with Bootstrap’s responsive layout for all the same reasons I discussed in my post about D3.js. Second, I tried using the dynamic Maps but disabling most event handlers. This also works, but eliminates the ability to browse the map and see the metadata I’ve associated with each map pin.

So, for now, I’ve restored the panning controls and draggable maps and just try to scroll carefully. Thoughts? I’d love to hear from you how you solved this problem.


Posted in HTML5, Ruby on Rails | 4 Comments

Video of my YUIConf talk about open web app development

yuiconf-wfwalkerThe YUIConf folks have just posted their recording of a talk I gave there last year. I had planned to talk generally about the Firefox Marketplace, how it differs from other app stores, and how those differences create an overall apps ecosystem unlike other app ecosystems. All true, and all important.

I ended up giving a completely different talk. I decided I really wanted to show to use the Firefox developer tools to test, deploy, and debug an open web app running live on a Firefox OS phone. I had a lot of fun demoing live, including use of my patent pending cardboard and WebRTC ELMO replacement.

Take a look, I hope you enjoy it!

http://www.yuiblog.com/blog/2014/02/24/yuiconf-2013-bill-walker-on-firefox-marketplace-breaking-the-stranglehold-of-app-stores/

Posted in HTML5, Mozilla, Trip Reports | Leave a comment

Replacing Google Image Charts with D3.js

[When I’m not in the office, I’m often out birding and photographing birds. To keep track of my life list and bird photos I wrote a Ruby on Rails site hosted at birdwalker.com; you can see all the source on github. This post is about some recent improvements to that code]

When I first discovered Google Image Chart API, I had written little JS and was excited about how easily I could create decent-looking bar charts without including big libraries or writing a lot of code. I added a method in my Rails ApplicationHelper class to generate a URL for the Google Image Chart API by encoding my parameters and data values into the expected format:

def counts_by_month_image_tag(totals, width=370, height=150) 
  monthly_max = 10 * (totals[1..12].max / 10.0).ceil

  stuff = {
    :chco => 555555,
    :chxt => "y",       
    :chxr => "0,0," + monthly_max.to_s,
    :cht => "bvs",
    :chd => "t:" + totals[1..12].join(","),
    :chds => "0," + monthly_max.to_s,
    :chs => width.to_s + "x" + height.to_s,
    :chl => Date::ABBR_MONTHNAMES[1..12].join("|")
  } 

  chartString = ("http://chart.googleapis.com/chart" + "?" + 
    stuff.collect { |x| x[0].to_s + "=" + x[1].to_s }.join("&")).html_safe

  ("<img src=\"" + chartString + "\" alt=\"Totals By Month\" width=\"100%\"/>").html_safe
end

I started using this helper from my various page templates and all was well. Time went by.

Eventually, I became disenchanted with this solution. I can develop and test the rest of the site locally on my laptop, but the external image URL’s like those aren’t reachable offline. The Google chart images are statically sized, so they’re ill-suited to responsive design frameworks like Twitter Bootstrap. And, rendering charts as images doesn’t allow for any interactivity. [note: Google addressed these deficiencies in a subsequent version of their Chart API, which does most of the work client-side, and adds a lot of scope for interactivity].

Meanwhile, I became more comfortable with JS and began to create more of birdwalker.com using it. After attending a conference talk about D3, I decided to copy a sample bar chart and adapt it for my purposes. I put the finished code in a Rails partial called _species_by_month.html.erb

D3.js code works by chaining many function calls together. Each call has a very specific purpose, and the calls can generally go in any order. By chaining them together, you get the overall behavior you want. For example, to create the bars in my bar graph I do this:

var bars = svg.selectAll("rect").remove().data(sightingData).enter()
  .append("rect")
  .attr("x", function(d, i) { return x(d.month); })
  .attr("y", function(d, i) { return y(d.count);})
  .attr("height", function(d, i) { return height - y(d.count); })
  .attr("width", function(d, i) { return x.rangeBand(); })
  .attr("class", "bargraph-bar"

The calls to attr() specify the location and size of an SVG rectangle and assign it a CSS style name. By calling data() you can iterate over an array of data; by calling enter() you can create new SVG nodes for each item in the array. In this case, we iterate over twelve numeric values representing birding activity during each month of the year and create twelve rectangles.

These new graphs resize nicely as elements within my Bootstrap layout. And I was able to create a tooltip when mousing over each bar like this:

svg.selectAll("rect").on("mouseover.tooltip", function(d){
    d3.select("text#" + d.month).remove();
    svg
    .append("text")
    .text(d.count)
    .attr("x", x(d.month) + 10)
    .attr("y", y(d.count) - 10)
    .attr("id", d.month);
});

And remove the tooltip on mouse exit like this:

svg.selectAll("rect").on("mouseout.tooltip", function(d){
    d3.select("text#" + d.month).remove();
});

The tooltips are styled with CSS just like the other graph elements.

So far, my experience with D3 has been really great. I now have graphs that work well in a responsive layout, don’t require external image links, and have some interactivity. Suggestions and code reviews welcome!

-Bill

Posted in HTML5, Ruby on Rails | 1 Comment

DevCon5 — on learning from games, Monty Sharma, Mass Unity

Monty Sharma gave a great talk this morning at DevCon5 about the current trends in games and what the rest of us can learn from them. He centers on three big ideas:

  • Free-to-Play. Find a way to let dedicated users pay more to get more stuff, but offer free functionality to everybody who asks
  • Compulsion Loops. Find ways to get people hooked into coming back to your software in order to satisfy some compulsion
  • Engaged Communities. Give up some control to bring your users into a community with one another.

I was really interested in his retelling of the EVE Online community responding to something called GoonSwarm. I can’t quite follow the internal politics of the game, but I can see that thousands of users organized themselves into highly effective ad hoc groups in order to battle one another within the game. Are your users that passionate and engaged?

Posted in Trip Reports | Leave a comment

jsEverywhere: Apathy is the Enemy of Awesome by Nancy Lyons

Nancy Lyons of geekgirlsguide gives a real end-of-day pep talk about how failed communication and collaboration can kill projects. I’ll put in a few of her zingers and how I understand them:

  • Learn how to talk about what you do to people who have no idea what you’re talking about.

Her evangelical zeal is very refreshing; I can imagine her listening to all these tech talks and thinking, “none of this is going to save you if your team can’t talk to each other.”

  • Don’t drop truth bombs

She urges us to imagine what non-technical clients who haven’t thought about iterations and known bugs will hear when you talk about bugs.

  • Don’t define scope in a consulting proposal

Instead, define the requirements collaboratively alongside the client. You have no idea what you’re talking about when you start!

Posted in Uncategorized | Leave a comment

jsEverywhere: PhoneGap CLI and PhoneGap Build Steve Gill, Adobe

Steve Gill is demoing “Cordova Client”, in which you have command-line tools to build, deploy, and manage Cordova-based applications on Blackberry, Android, and iOS. This is still in beta. It’s at github.com/filmaj/cordova-client. It requires Node.js, should be available in npm.

Posted in Uncategorized | Leave a comment

jsEverywhere: From Continuous Integration to Continuous Delivery by Morten Nielsen

Morten‘s presentation is a hilarious, compelling fable of what happens when a .NET shop relying on manual processes becomes a victim of its own success and ends up with an exploding number of software versions in the field. The fable ends happily using Hudson and Jenkins for repeatable, automated deployments. Whew.

Posted in HTML5, Trip Reports | Leave a comment